View Adobe Acrobat Version | Download Adobe Acrobat Reader
Data collected for this study reveal that the patterns of access to and utilization of mental health care are widely divergent throughout the State.� Variation is shown most clearly through a review of penetration, per capita and per recipient expenditures and claims.� We collected this information from the CFR and from Medicaid claims data.
Proportion of Expenditures Devoted to each Type of Service
We reviewed the proportion of CFR expenditures devoted to each type of service by region (see Attachment D).� While there were differences between regions, the variation was not extreme.� For example, expenditures on care coordination as a proportion of expenditures on all services ranged from 19.2 percent in New York City to 25.4 percent in Central New York.� Day Rehabilitation services showed slightly higher variation, accounting for 18.1 percent of expenditures in Central New York and 28.9 percent in Hudson River.�
Per Capita Spending
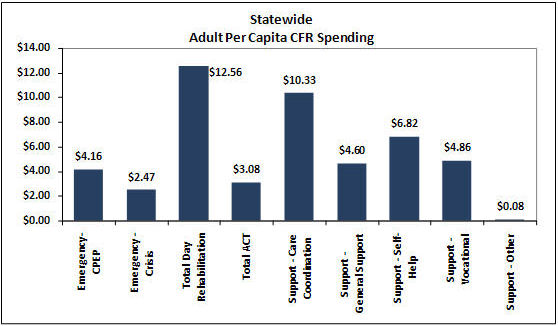
More interesting information is found by looking at CFR spending on a per capita basis (total CFR spending[59] divided by the adult population as shown in the 2006 US Census).� Statewide adult per capita CFR spending data are presented in Figure F-1, below.�
Figure F-1 Statewide Adult Per Capita CFR Spending

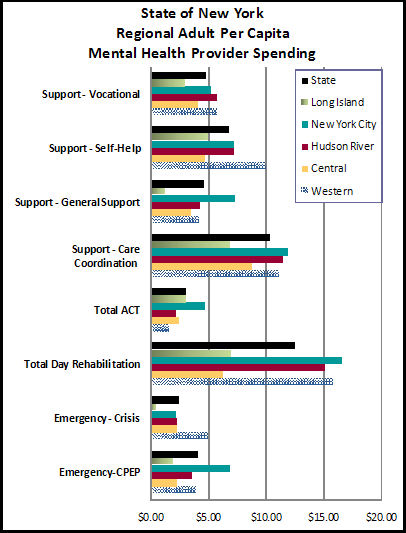
In order to better understand provider capacity and the supply of services in each region, we also analyzed regional per capita spending levels based on provider location and service type (see Figure F-2).[60]��
Central New York and Long Island stand out as having low per capita spending levels for services. Per capita rates for Care Coordination range from $6.94 in Long Island to $11.47 in Hudson River.� Day Rehabilitation rates were $16.59 in New York City but $6.24 in Central New York.� Care coordination, vocational support services and ACT show the least regional variation.
Figure F-2 � Regional Adult CFR Per Capita Spending

A comprehensive analysis of regional ambulatory capacity should also include utilization clinic and ambulatory State operated services, particularly since State hospitals are not distributed evenly across the State.� This was beyond the scope of our study.
Medicaid Penetration Rates
Overall adult Medicaid penetration rates[61] vary significantly by county, ranging from 6.4 percent to almost 23 percent.� Analyzed on a regional basis to reduce intercounty variation, rates ranged from 9.5 percent to 17.6 percent (see Figure F-3 below).� Medicaid recipients in Western New York have the highest penetration rate, almost double the rate of NYC and almost four percentage points higher than the next closest region, Central NY.�
Figure F-3 � Medicaid Penetration

The differences among penetration rates may be due to supply of services, the result of different practice patterns, system structure or perhaps the availability of resources.� Interviews and focus groups confirmed that practice patterns are perceived to vary dramatically across counties or regions, based on the availability of specific service types and the training and experience of staff.�
There are significant and surprising differences among the regions in penetration and per capita[62] and per recipient[63] expenditure levels for each service type (see Tables F-4-6).
Table F-4 � Regional Mental Health Penetration by Service
| Regional Medicaid Penetration by Service Category | |||||
|---|---|---|---|---|---|
| Central NY | Hudson River | Long Island | New York City | Western NY | |
| Ambulatory | 3.8% | 4.3% | 5.5% | 2.4% | 5.4% |
| Residential | 0.7% | 1.0% | 1.0% | 0.2% | 0.7% |
| Hospital Inpatient | 2.0% | 2.6% | 2.3% | 1.7% | 2.1% |
| Partial Hospitalization | 0.0% | 0.4% | 0.5% | 0.1% | 0.4% |
| State Hospital | 0.01% | 0.01% | 0.00% | 0.00% | 0.00% |
| PMHP | 1.1% | 0.8% | 0.6% | 0.3% | 0.2% |
| Clinic Service Individual | 11.1% | 10.2% | 7.4% | 7.3% | 15.2% |
Table F-5 � Spending Per Capita by Service
| Regional Medicaid Spending per Capita | ||||||||
|---|---|---|---|---|---|---|---|---|
| Central NY | Hudson River | Long Island | New York City | Western NY | ||||
| Ambulatory | $153.27 | $268.49 | $308.25 | $142.38 | $216.88 | |||
| Residential | $99.65 | $170.96 | $263.85 | $40.06 | $110.08 | |||
| Hospital Inpatient | $141.45 | $338.13 | $345.61 | $397.00 | $171.46 | |||
| Partial Hospitalization | $0.26 | $6.19 | $7.28 | $2.81 | $3.31 | |||
| State Hospital | $2.09 | $2.10 | $0.02 | $1.01 | $0.47 | |||
| PMHP | $169.84 | $120.94 | $99.52 | $36.81 | $37.78 | |||
| Clinic Service Individual | $164.94 | $251.78 | $237.16 | $157.49 | $202.01 | |||
| Total | $731.49 | $1,158.60 | $1,261.69 | $777.55 | $741.99 | |||
Table F-6 � Spending Per Recipient by Service
| Regional Medicaid Spending per Recipient | |||||||
|---|---|---|---|---|---|---|---|
| Central NY | Hudson River | Long Island | New York City | Western NY | |||
| Ambulatory | $4,047 | $6,233 | $5,611 | $5,900 | $4,030 | ||
| Residential | $15,092 | $17,403 | $25,719 | $18,029 | $15,038 | ||
| Hospital Inpatient | $7,059 | $13,095 | $15,354 | $23,752 | $7,991 | ||
| Partial Hospitalization | $2,299 | $1,448 | $1,476 | $2,848 | $935 | ||
| State Hospital | $18,835 | $33,669 | $1,020 | $103,579 | $9,735 | ||
| PMHP | $15,757 | $15,002 | $16,565 | $14,636 | $15,437 | ||
| Clinic Service Individual | $1,487 | $2,477 | $3,220 | $2,144 | $1,325 | ||
The data reveal interesting relationships between the regional penetration rates, capitation rates and rates per recipient (total claims divided by unduplicated total of consumers). �Western New York has a dramatically higher overall penetration rate (primarily due to clinic access rates), and relatively low per capita and per recipient costs (in comparison with other regions).� New York City has low penetration, low overall per capita costs, the lowest ambulatory costs and highest inpatient hospital costs.�
The regional variations in service access, cost and utilization are the result of historical State funding practices or they reflect the role of individual counties in budgeting, staffing and contracting for mental health services in New York. Until recently, county funds and State Aid to counties provided a significant portion of both the non Medicaid services and the required State match for Medicaid funding.� However the county Medicaid contribution has been capped in recent years, reducing county incentives to control growth of Medicaid spending.� The significantly different economies, policies and priorities in New York City, other urban areas and the remaining counties further compound the disparities in spending and programming that are seen today.� State operated services, also play a part in these regional funding disparities. �Ultimately the factors that drive these differences need to be studied further and local planning should incorporate these data, developing strategies to reduce unwanted variation.